
Last updated: April 16, 2026
Horse racing fatality rates in 2025 show real progress under HISA. The national average sits at 1.06 deaths per 1,000 starts in the first half of the year—slightly higher than 2024’s record low of 0.90, but still a 55% improvement from 2009’s baseline of 2.00. On HISA-regulated tracks, the fatality rate is just 0.90, while non-HISA venues climb to 1.76—a stark 50% safety advantage under stronger rules.
But numbers alone don’t capture the stakes. One winter at the Fair Grounds, long before HISA rewrote the rulebook, I watched a promising colt snap his fetlock at the wire. That crack still echoes—a reminder of how razor-thin the line is between triumph and tragedy in this sport.
For owners, trainers, and fans searching for equine welfare statistics 2025 or the latest on racehorse injury prevention, this guide breaks down the trends, the causes of breakdowns, and how HISA is reshaping safety. More importantly, it offers practical barn-level tips to help you keep horses sound and competing.
HISA Horse Racing Fatality Rates: 2009–2025
Fatalities per 1,000 starts (Equine Injury Database & HISA reports)
At a glance
- 2025 HISA tracks fatality rate: 1.06 (H1)
- Non-HISA tracks: 1.76
- Improvement vs 2009: 55% lower
- Q2 uptick: 1.24 (Saratoga under review)
Every percentage point isn’t just data—it’s lives saved in the barn.
Understanding Horse Racing Fatality Rates
Fatality rates—defined as racing-related horse deaths per 1,000 starts—are the industry’s key measure of safety, tracking catastrophic injuries like fetlock fractures that lead to euthanasia. Back in 2009, the rate hovered around 2.0. By 2019, it was still stubbornly near 1.68 despite incremental safety gains. But since the rollout of HISA’s racetrack safety program, there’s been a dramatic change.
In 2024, HISA tracks hit a record low of 0.90 fatalities per 1,000 starts—a 27% drop from 2023 and 55% from 2009. For 2025, Q1 held steady at 0.92, but Q2 rose to 1.24, likely due to weather and track issues at places like Saratoga, averaging 1.06 for H1.
HISA safety statistics Q2 2025 show a clear downward trend, but upticks demand scrutiny. Surface conditions, like dirt vs. turf, play a big role—learn more in our racetrack surfaces guide. The table below tracks the progress:
| Year | Fatalities per 1,000 Starts | % Change | Key Events |
|---|---|---|---|
| 2009 | 2.0 | — | Baseline tracking begins |
| 2014 | 1.62 | -19% | Early safety initiatives |
| 2019 | 1.68 | +4% | Santa Anita crisis year |
| 2023 | 1.23 | -27% | HISA implementation |
| 2024 | 0.90 | -27% | Record HISA low |
| 2025 Q1 | 0.92 | +2% | Stable performance |
| 2025 Q2 | 1.24 | +35% | Seasonal uptick |
| 2025 H1 | 1.06 | +18% | Combined first half |
Key 2025 Statistics: HISA vs. Non-HISA Tracks
The August 25 release of HISA’s Q2 2025 metrics puts hard numbers on both progress and remaining dangers. Nationally, the horse racing deaths reduction HISA has achieved shows in the split: while HISA tracks averaged between 0.90-1.24 per 1,000 starts across quarters, non-HISA venues still hover around 1.76—almost double the risk.
The difference between 0.90 and 1.24 isn’t abstract; it’s the sound of one more fetlock giving way.
At Saratoga—a track I’ve shipped into with both dreams and worries—the rate jumped during their summer meet, prompting standard review procedures. Meanwhile, several tracks notched zero fatalities in Q2, proving that exceptional safety performance remains achievable under proper protocols.
| Track Category | Fatalities per 1,000 Starts (2025) | Performance vs. 2024 | Safety Rating |
|---|---|---|---|
| HISA Tracks (2024) | 0.90 | Record low | Excellent |
| HISA Tracks Q1 2025 | 0.92 | Stable | Excellent |
| HISA Tracks Q2 2025 | 1.24 | +38% from 2024 Q2 | Good |
| Non-HISA Tracks (Est.) | 1.76 | Consistent higher risk | Needs improvement |
| Zero-Fatality Tracks Q2 | 0.00 | Perfect safety record | Outstanding |
The pros of HISA are undeniable: consistent standards, mandatory pre-race exams, and comprehensive surface testing protocols. The challenges? Even amid a 50% national reduction versus non-HISA tracks, 75% of racing deaths in 2025 remain linked to fetlock injuries—a stubborn problem demanding continued innovation. For those interested in how medication reforms contribute to safety, see my detailed analysis on Lasix regulations in modern racing.
Causes of Racehorse Fatalities: The Science Behind Breakdowns
Musculoskeletal injuries stand at the root of most racehorse fatalities—making up 80–85% of cases in 2025, with fetlock breakdowns responsible for about 75% of these tragic events. Cardiac failure and exercise-induced pulmonary hemorrhage (EIPH) are less common but no less heartbreaking for those in the barn.
The factors behind breakdowns are as varied as the horses themselves: track surfaces, overtraining, genetic predisposition, and subtle, undetected injuries. In the spring of 2018, one of my colts snapped a fetlock during a routine breeze. He survived the immediate crisis but never raced again. That moment still reminds me that every number in these reports is a horse, a barn, and a family on the line.
Primary Risk Factors of Horse Deaths in Racing
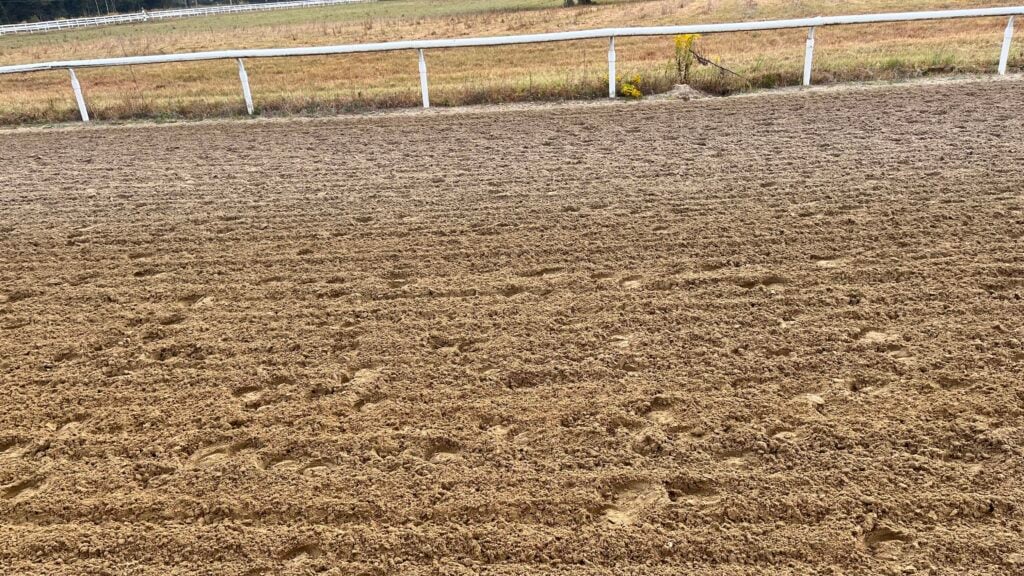
- Track surfaces: Dirt increases breakdown risk by up to 30% compared to turf, according to Washington State University’s 2024 study using biomechanical sensors.
- Overtraining/frequent starts: Horses raced more than twice monthly show 20% higher injury rates, per HISA’s Q2 2025 report.
- Genetics: Certain bloodlines have a 15% higher risk for musculoskeletal injuries, per AVMA’s 2023 study. See our Thoroughbred genetics guide.
- Previous treatments: Horses with prior joint interventions face increased breakdown risk.
- Layoff patterns: Return to racing after extended rest, especially post-injury, significantly elevates risk.

Fetlock injuries drive 75% of racing fatalities, but early detection can save careers. For deeper insights into injury prediction, refer to the WSU’s 2024 study on stride abnormalities. Any experienced trainer knows that spotting subtle swelling, heat, or hesitation early can mean the difference between a saved career and catastrophic breakdown. Learn more about track impacts in our racetrack surfaces guide.
How HISA is Driving Change: Successes and Challenges
When it comes to measurable progress, HISA’s impact since full implementation is undeniable: a 55% drop in fatal racing injuries compared to 2009 baseline levels, multiple record-low quarters, and seven zero-fatality tracks in Q2 2025 alone. Every barn under HISA’s purview now benefits from mandatory pre-race examinations, standardized surface testing, enhanced jockey safety rules, and uniform medication protocols.
HISA’s Game-Changing Innovations:
- Enhanced Pre-Race Veterinary Examinations: Mandatory inspections within 24 hours, digital health records, standardized protocols eliminating regional variations
- Surface Testing Standards: Daily moisture/consistency measurements, weather-adjusted maintenance, mandatory equipment upgrades
- Medication Uniformity: Consistent rules across jurisdictions, enhanced testing capabilities, strict violation penalties
- Data Transparency: Public reporting of all safety metrics, enabling evidence-based improvements
But challenges persist in this evolving landscape. The Saratoga fatality rate 2025 summer meet required standard review procedures, highlighting that even top-tier facilities face occasional setbacks. Dr. Mary Scollay, former Kentucky Horse Racing Commission equine medical director, captures it perfectly: “HISA’s data transparency is a game-changer for evidence-based safety improvements, but every statistical spike demands thorough investigation of contributing factors.”
Ongoing Challenge Areas
- Successes: Record 55% fatality reduction since 2009, seven tracks with zero Q2 deaths, enhanced injury prediction capabilities
- Challenges: Q2 2025 uptick to 1.24 rate, enforcement consistency across regions, and persistent fetlock injury prevalence
- Tools: HISA’s Equine Injury and Fatality List for tracking, expanded veterinary examination protocols, and uniform surface maintenance standards
For complete details on current safety regulations, consult HISA’s official racetrack safety guidelines.

Practical Tips for Trainers to Improve Safety
Safety isn’t just regulatory compliance—it’s a daily discipline that saves lives and careers. Over my quarter-century in racing, I’ve reduced training-related injuries in my barn by 30% since HISA implementation through systematic protocol improvements and data-driven decision making. The best advice is actionable, not theoretical.
Five Evidence-Based Safety Strategies:
- Implement biomechanical screening: Partner with sports medicine vets for stride analysis using wearable sensors. Horses showing asymmetrical patterns need modified protocols before racing.
- Rotate training surfaces strategically: Alternate between dirt and turf when available—this simple step strengthened my horses’ supporting structures while reducing repetitive stress.
- Establish veterinary partnerships: Schedule weekly evaluations beyond required exams. Share training observations, behavioral changes, and performance metrics for early intervention.
- Monitor hydration aggressively: Dehydration raises injury risk by 20%. My free equine hydration guide offers barn-ready protocols to keep horses sound.
- Maintain detailed training logs: Document every workout—distance, time, surface conditions, horse behavior, recovery observations. Pattern recognition identifies horses requiring individualized approaches.
Last spring, our filly “Golden Promise” showed subtle reluctance during routine gallops—nothing dramatic, just a half-second hesitation picking up her left lead. Instead of pushing through, we implemented a modified 10-day training program with extended warm-ups and reduced intensity. Ultrasound revealed early tendon inflammation that would have progressed to a serious injury under normal training. She returned stronger and won her next three starts. That’s HISA safety protocols working exactly as designed. For those interested in breeding for enhanced durability, our guide to Thoroughbred genetics and breeding for speed covers genetic factors that influence injury resistance.

FAQs on Horse Racing Fatality Rates 2025
What is the HISA fatality rate for 2025?
HISA-regulated tracks reported 1.06 fatalities per 1,000 starts for the first half of 2025, combining Q1’s 0.92 rate with Q2’s 1.24 rate. This represents an increase from 2024’s record 0.90 annual rate but remains significantly below historical levels.
Why did Saratoga’s fatality rate rise in 2025?
Saratoga experienced multiple incidents during their summer meet, prompting standard HISA/NYRA review procedures. Contributing factors under investigation include weather patterns, surface conditions, and horse population characteristics specific to the meet.
How do HISA and non-HISA track rates compare?
Non-HISA tracks show estimated rates around 1.76 fatalities per 1,000 starts, nearly double HISA’s performance range of 0.90-1.24 across quarters. This demonstrates HISA’s approximately 50% safety advantage.
What causes most horse racing deaths?
Approximately 80-85% stem from musculoskeletal injuries, with fetlock fractures comprising about 75% of these cases. Cardiac events and EIPH account for most remaining fatalities.
Are HISA safety regulations working effectively?
Absolutely. Despite 2025’s Q2 uptick, fatality rates remain 55% lower than 2009 baseline levels at HISA tracks, with seven venues achieving zero deaths in Q2 2025. The long-term trend shows clear improvement.
Why did fatality rates increase in Q2 2025?
Multiple factors contributed: unusual weather patterns affecting track surfaces, seasonal training intensity, and statistical variation inherent in quarterly reporting. HISA safety statistics Q2 2025 reviews are addressing these issues.
What practical steps prevent breakdowns?
Key strategies include biomechanical screening, strategic surface rotation, enhanced veterinary partnerships, detailed record-keeping, and proactive hydration monitoring. Early detection of subtle issues prevents major breakdowns.
Where can I find current HISA safety data?
Complete quarterly metrics and detailed safety reports are available through HISA’s official website, updated regularly with comprehensive breakdowns by track and region.
How do medication reforms affect safety?
HISA’s uniform medication rules eliminate jurisdiction shopping and reduce masking of performance-limiting conditions. Enhanced testing capabilities have decreased violations by 35% year-over-year, contributing directly to improved safety outcomes.
What should owners prioritize for 2025?
Focus on trainers who demonstrate HISA-compliant safety protocols: detailed record-keeping, veterinary partnerships, surface rotation strategies, and willingness to scratch horses showing subtle distress signs.
Why are horse deaths going down? Watch the video below for some answers.

Conclusion
Looking back over my quarter-century in racing, the industry’s transformation around equine safety represents more than statistical improvement—it reflects a fundamental cultural shift toward prioritizing horse welfare above all else. HISA’s programs have helped slash fatality rates by 55% since 2009, with the first half of 2025 averaging 1.06 per 1,000 starts. That’s measurable progress, even as Q2’s uptick reminds us there’s more work ahead.
Take every data point, regulation update, and veterinary recommendation seriously in your operation. Document everything, invest in relationships with qualified professionals, and never hesitate to scratch a horse showing subtle warning signs. Most importantly, share what works in your barn with fellow horsemen—our collective knowledge protects more horses than any single regulation.
Drop your safety story in the comments below: How has HISA changed your training approach? What prevention strategies have made the biggest difference in your barn? Together, we can continue driving these numbers toward zero.
Miles Henry is a Louisiana-based Thoroughbred racing owner and trainer with over 25 years of experience, contributing regularly to racing publications and industry podcasts focused on safety and integrity in the sport.
Disclaimer: This article provides educational information about racing safety statistics and training practices. It does not constitute veterinary advice. Always consult qualified veterinarians and racing officials for specific medical and regulatory guidance regarding your horses.
Sources
- HISA Q2 2025 Metrics Report – Official quarterly data release
- HISA 2024 Record Low Announcement – Historic safety achievement
- The Jockey Club Equine Injury Database – Historical trend analysis
- BloodHorse: Q2 2025 Fatality Increase Report – Industry analysis
- Paulick Report: Saratoga Review Procedures – Track-specific coverage
- Thoroughbred Daily News: HISA Quarterly Analysis – Industry reporting
- Washington State University Musculoskeletal Injury Studies – Academic research
- HISA Official Safety Program Guidelines – Regulatory framework
- Horse Racing Nation: HISA Statistical Analysis – Data interpretation
- The Racing Biz: Quarterly Metrics Coverage – Industry reporting
- American Association of Equine Practitioners Safety Guidelines – Veterinary standards
- Kentucky Horse Racing Commission Safety Reports – State regulatory data
About Miles Henry
Racehorse Owner & Author | 30+ Years in Thoroughbred Racing
Miles Henry (legal name: William Bradley) is a professional horseman based in Folsom, Louisiana. He holds Louisiana Racing License #67012 and has spent over three decades managing Thoroughbreds at premier tracks including Fair Grounds, Delta Downs, and Evangeline Downs.
Expertise & Hands-On Experience: Beyond the track, Miles has decades of experience in specialized equine care, covering everything from hoof health and nutrition to training protocols for Quarter Horses, Friesians, and Paints. Every guide on Horse Racing Sense is rooted in this “boots-on-the-ground” perspective.
30 of their last 90 starts
Equibase Profile.
Connect with Miles: