Last updated: June 26, 2026
How to read a racing form — the short version: Start with the race class and conditions, compare the last three speed figures across horses, check for class drops and equipment changes, identify the pace scenario, and confirm with trainer stats. Those five steps cover most of what goes into a sound betting decision.
- Speed figures: Usually the quickest starting point for comparing horses — adjusted for track conditions so figures from different tracks are more directly comparable
- Class context: A figure earned dropping from a $25,000 claiming race is worth more than the same figure earned in maiden company
- Equipment changes: First-time blinkers and first-time Lasix can be meaningful positive signals, particularly when supported by improving form or class placement
- Trainer win %: One of the most useful baseline statistics in the form — trainers winning above 15% consistently place horses in competitive spots
- Pace: Three speed horses in the same field means fast early fractions and closers benefit; one lone speed horse means the front-runner can rate and conserve
Every number in a racing form means something — but not all of them matter equally. Beginners focus on finish position and final time. Experienced horseplayers know the real story is in a handful of key signals: speed figures, class level, pace, trainer stats, and equipment changes. Once you know what to look for, a racing form stops being confusing and starts being the most useful tool in racing.
About this guide: Based on my experiences reading racing forms — for horses I own and for races I was trying to beat. Racing form terminology and speed figure explanations cross-referenced with Equibase and Daily Racing Form standards.
Table of Contents
What Is a Racing Form?
A racing form — more precisely called “past performances” — is a standardized record of a horse’s recent race history. For each race it shows where the horse ran, the distance and surface, the class of race, the weight carried, the horse’s position at each timing call during the race, the final time, and a speed figure comparing that performance to other races.
Daily Racing Form (DRF) publishes the most detailed and widely used past performances in American racing, and their Beyer Speed Figures have been the industry standard for decades. Equibase — owned by the tracks themselves — publishes free past performances that are nearly as complete. Both formats contain essentially the same information; the layout and proprietary speed figures differ.
Horseman’s Perspective: I’ve owned horses for over 30 years and I still read the form on every race my horses run in — not to learn about my own horse, but to understand the competition. The past performances tell me how fast the other horses have run, what class they’ve been running in, whether any of them just dropped in class with a new trainer, whether there are equipment changes signaling a barn that has identified a problem and fixed it. The form is a published intelligence file on every horse in the field. Not reading it is like playing poker without looking at your cards.
How to Read a Racing Form: Beginner Step-by-Step
If you’re opening a racing form for the first time, here is the shortest path from confusion to a usable opinion. Each step builds on the one before it — you don’t need all six to make a reasonable bet, but the more you use, the better your decisions get.
| Step | What to Do | What You’re Looking For |
|---|---|---|
| 1 — Read the race conditions | Look at the top of the race page — the class level, distance, and surface | What kind of race is this? Claiming, allowance, maiden? How far? Dirt or turf? This frames every number that follows. |
| 2 — Look at each horse’s last 3 races | Scan the three most recent lines for each horse — date, track, class, and finish position | Is the horse recent or coming off a layoff? Has it been running at this class level or higher? Consistent runner or erratic? |
| 3 — Compare speed figures | Find the speed figure column (a two- or three-digit number near the end of each line) | Higher is better. Look for the trend: improving (going up), declining (going down), or consistent. Give extra credit to horses with rising figures. |
| 4 — Check class level | Compare the class of today’s race to the class each horse has been running in recently | A horse dropping from a $25,000 claiming race to a $16,000 claiming race gets full credit for those figures. A horse moving up from maiden gets a slight discount. |
| 5 — Identify running style | Look at the position calls (the numbers mid-line) across recent races | Does this horse run near the front (1-1-1) or come from behind (6-5-4-3-1)? Running style tells you whether today’s pace sets up for or against this horse. |
| 6 — Check trainer stats and equipment changes | Find the trainer win percentage and look for any new equipment noted | A trainer winning at 15%+ is a hot barn. Any new equipment — especially blinkers or Lasix for the first time — signals the trainer has fixed a specific problem. |
Where to Get Past Performances
| Source | Cost | Speed Figures | Best For |
|---|---|---|---|
| Equibase.com | Free (basic); paid upgrades available | Equibase Speed Figure | Beginners; casual bettors; owners checking their own horse’s lines |
| Daily Racing Form | $1–$3 per race card; subscription options | Beyer Speed Figure | Serious handicappers; most detailed format with the most widely cited speed figures |
| TwinSpires / FanDuel Racing / TVG | Free with ADW account | Varies by platform | Bettors who wager online — form is built into the wagering interface |
| Brisnet | $1–$2 per race card | Brisnet Speed Rating | Value alternative to DRF; includes pace figures and trainer/jockey stats |
| Track programs | $2–$5 at the track | Basic only (no Beyer) | At-track bettors; orientation only — not sufficient for serious handicapping |
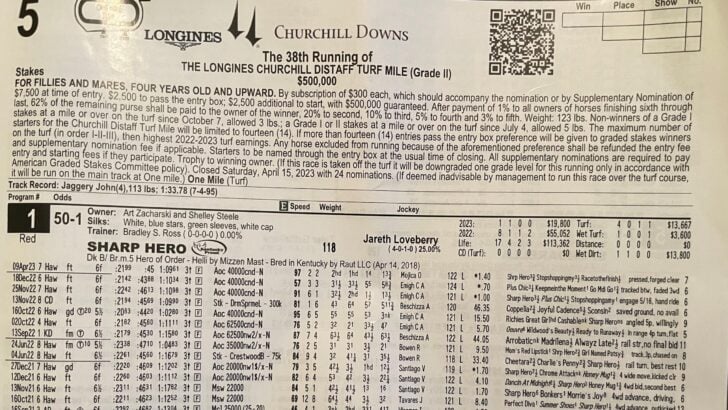
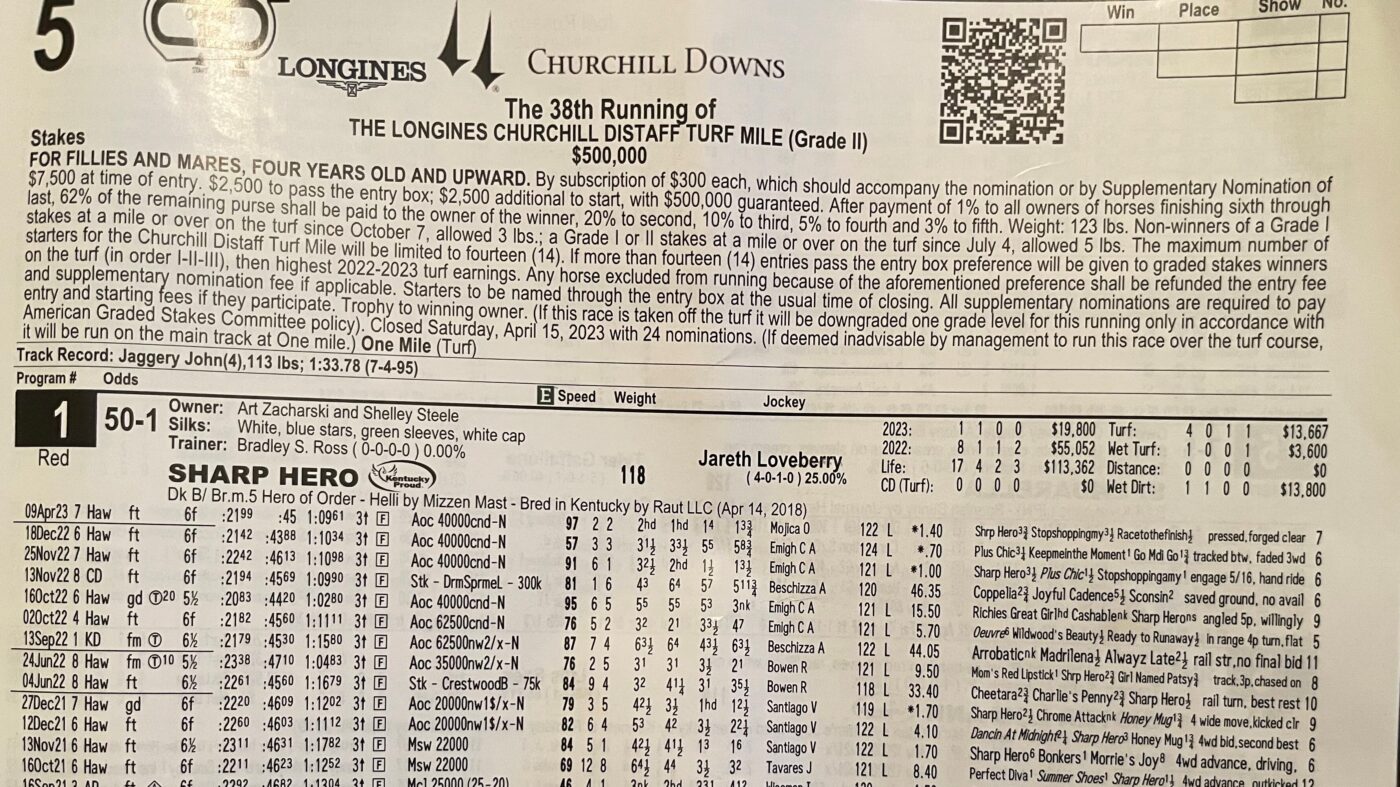
The Anatomy of a Past Performance Line
Each line in the past performances represents one race. A horse with six recent starts has six lines, stacked with the most recent at the top. Here is what a typical past performance line looks like, followed by a field-by-field breakdown:
05/12 — Date of the race (May 12)
FG — Track abbreviation (Fair Grounds)
6f — Distance: six furlongs (¾ mile)
ft — Track condition: fast
Clm 16000 — Race type and claiming price: claiming race at $16,000
118 — Weight carried (jockey + saddle + lead weights)
3 — Post position drawn
5 — Position at the start / first call
5³ — Position and lengths behind at the second call (5th, 3 lengths back)
4² — Position and lengths behind at the third call (4th, 2 lengths back)
2¹ — Position and lengths behind at the stretch call (2nd, 1 length back)
1hd — Final position and margin: won by a head
1:11.2 — Final time (1 minute, 11 and 2/5 seconds)
85 — Speed figure (Beyer or Equibase)
L — Lasix (ran on the medication Furosemide)
b — Blinkers (wore blinkers in this race)
The position calls at each point in the race tell a story. A horse that ran 5th-5th-4th-2nd-1st is a closer that was well back early and finished strongly. A horse that ran 1st-1st-1st-1st-2nd was a front-runner that faded slightly at the end. A horse that ran 3rd-3rd-4th-6th-8th was competitive early and stopped badly — a sign of a possible physical issue, poor trip, or a horse outclassed at that level.
| Field | What It Shows | Priority |
|---|---|---|
| Race type / class | Claiming price, allowance conditions, stakes grade | Very High — the most important context for reading speed figures |
| Distance | How far the race was | High — distance preferences are real and persistent |
| Surface / condition | Dirt, turf, synthetic; fast / muddy / sloppy | High — surface preference is one of the most reliable factors |
| Speed figure | Normalized rating adjusted for track conditions | Very High — most comparable single number across tracks and days |
| Medication / equipment | Lasix, blinkers, tongue tie, etc. | High — especially for changes: first-time Lasix, new blinkers |
| Final time | Raw clocktime for the race | Low alone — meaningless without track variant; use the speed figure |
| Date | When the race was run | Low — use mainly for layoff assessment |
What Do the Numbers Mean?
The numbers in a past performance line fall into four categories: position numbers (where the horse was during the race), length numbers (how far behind it was), speed figures (how fast it ran compared to all horses), and fractional times (how fast each segment of the race was run).
| Number Type | Example | What It Means | How to Use It |
|---|---|---|---|
| Position numbers | 5 4 2 1 | Where the horse was running at each official timing call — 1st through last | Read the pattern: 5-4-2-1 is a closer finishing well; 1-1-1-2 is a front-runner who faded slightly. The pattern reveals running style. |
| Lengths behind (superscript) | 5³ 4² 2¹ 1hd | How many lengths behind the leader the horse was at each call | 5³ = 5th place, 3 lengths back. “hd” = head (less than a length). A horse 10+ lengths back early and finishing 2nd ran a very different race than one who was 2 lengths back the whole way. |
| Speed figure | 85 | A single number comparing how fast this horse ran to every other horse on this track this day, adjusted for track speed | Higher is better. Compare the last three figures across horses. An 85 means the same thing regardless of whether the race was fast or slow that day — that’s the point. |
| Fractional times | :22.3 :45.1 1:11.2 | How fast each segment of the race was run — quarter mile, half mile, final time | Fast early fractions (:44 half-mile or faster in a sprint) mean the pace was hot. Slow fractions mean front-runners coasted and had energy to spare. |
| Margin / finish notation | 1hd, 2¾, 3nk, 4² | How far behind the winner a horse finished — head (hd), neck (nk), or lengths | Context matters: a horse finishing 4th by 2 lengths in a competitive field ran a better race than one finishing 4th by 8 lengths. Check the field size and winning margin too. |
The Five Data Points That Matter Most
A full past performance line contains twenty or more data fields. Most handicappers — even experienced ones — prioritize five of them. If you can read these five accurately, you can make a competent betting decision on almost any race.
| Priority | Data Point | What You’re Looking For | Why It Matters |
|---|---|---|---|
| #1 | Speed figures (last 3 races) | Consistency, improvement, or decline trend | The most objective measure of raw performance — adjusted for track speed so figures from different tracks and days are comparable |
| #2 | Class of recent races | Is the horse dropping in class, moving up, or running at its usual level? | A speed figure earned in a $50,000 claiming race means something different than the same figure in maiden claiming — class context is essential |
| #3 | Trainer win percentage | Current meet or last 60 days — above 15% is worth closer examination | Trainer win percentage reflects sustained success over many starters and is one of the most useful baseline statistics in the form. It becomes even more informative when combined with class moves, equipment changes, and pace analysis — not every horse from a hot barn is a bet, but hot barns consistently place horses in competitive spots |
| #4 | Equipment changes | Any change from the previous race — especially first-time blinkers, first-time Lasix, tongue tie added | Equipment changes signal the trainer has identified a specific problem and is addressing it — one of the most underused signals in the form |
| #5 | Pace fractions + running style | Is this horse a front-runner, presser, or closer? Does today’s pace set up for its style? | The best horse in the field can lose if the pace scenario doesn’t suit its running style — pace analysis turns a speed figure exercise into a race-specific decision |
Horseman’s Perspective: When I sit down with a form, I don’t read it left to right. I go straight to trainer win percentage first — if a trainer is running at 20% or higher, every horse in that barn gets closer examination until the form gives me a reason to look elsewhere. Then I check for equipment changes. Then I look at the last three speed figures to see if the horse is improving or declining. Class comes fourth — is this horse dropping in, moving up, or running level? Pace is last, but it’s often where the final decision gets made. The form rewards a system, not a scan.
The form becomes most powerful when signals align — not when one signal stands alone.
A class drop by itself is interesting. A class drop combined with improving speed figures and a hot trainer is a strong play. Add first-time blinkers to that combination and you have one of the most reliable betting patterns in the form — four independent signals all pointing in the same direction. Most bettors find one reason to like a horse. Sharp bettors wait for convergence.
Strongest combinations: Class drop + improving figures + hot trainer | First-time blinkers + class drop | First-time Lasix + recent bullet workout | Hot trainer + jockey upgrade + recent claim
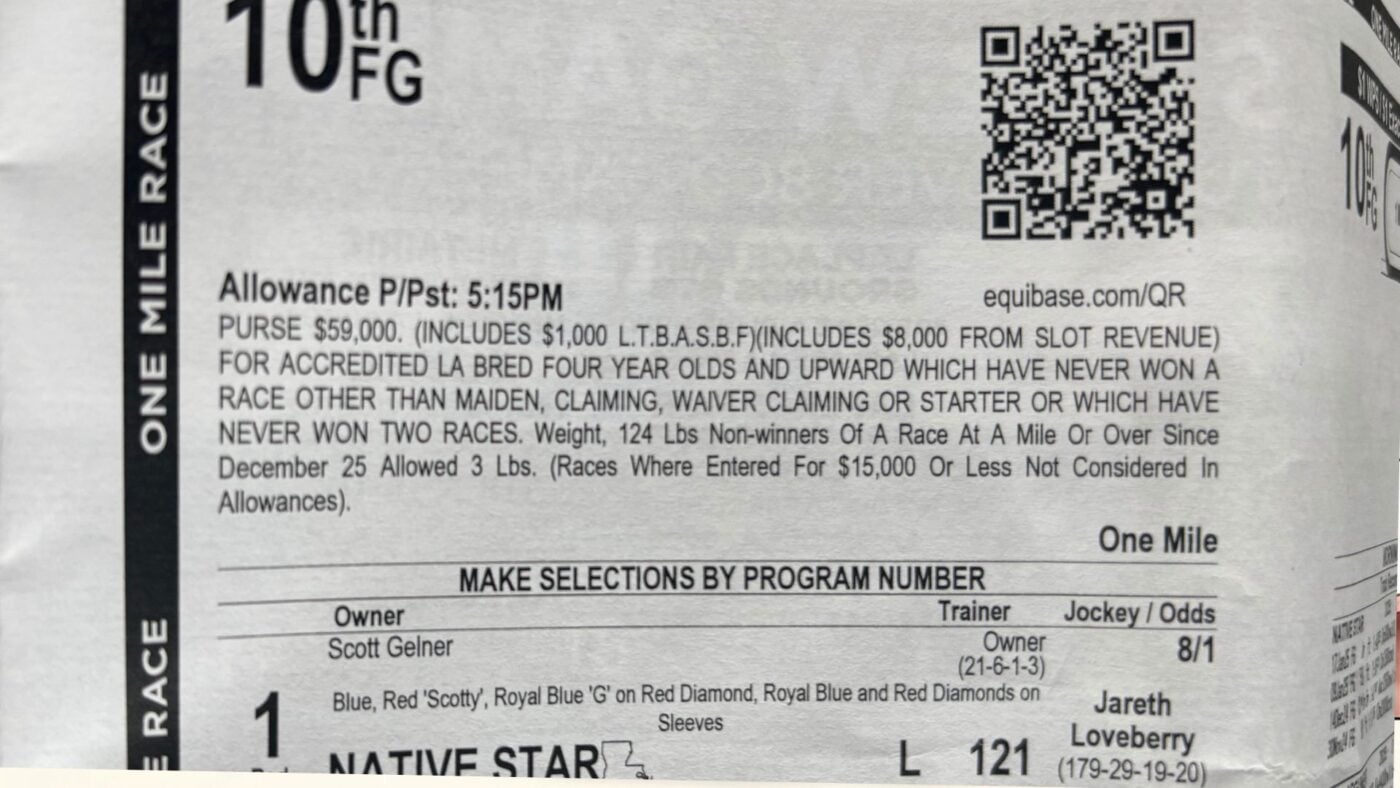
Reading the Race Header: Class and Conditions
Before reading a single horse’s past performance lines, read the race header — the information at the top of the page that describes the race itself. This is where the class level, eligibility conditions, purse, distance, and surface are listed. Understanding the race conditions tells you what kind of horse you’re looking at and what the speed figures mean.
| Header Element | Example | What It Tells You |
|---|---|---|
| Race type | CLM 16000, ALW, MSW, STK | The class level — claiming price, allowance, maiden special weight, or stakes. This is the most important single piece of context in the form. |
| Eligibility conditions | “NW2L” or “3yo+” or “F&M” | NW2L = non-winners of two lifetime; F&M = fillies and mares. Conditions restrict who can enter and affect competitive level significantly. |
| Purse | $18,000 added | Higher purses attract better horses. A $50,000 purse claiming race is more competitive than an $18,000 purse claiming race at the same price. |
| Distance | 6f, 1m, 1⅛m | Distance preference is one of the most persistent and reliable factors. A horse that has run well consistently at a mile should get credit for that regardless of other variables. |
| Surface | Dirt, Turf, AW (all-weather) | Surface preference is real and often dramatic — a horse that has struggled on dirt may be a completely different animal on turf. |
The class drop is one of the most important signals in the form. A horse that has been running in $25,000 claiming races and is entered today for $16,000 is dropping in class — it gets full credit for every speed figure it earned at the higher level. A horse moving up from maiden company needs a slight discount because it hasn’t yet proven itself against open competition. For a complete explanation of how the claiming system works within this context, see the guide to claiming races.
Speed Figures Explained
Speed figures are the single most useful number in the past performances — and the most misunderstood by beginners. A raw final time (1:11.2 for six furlongs) means very little on its own because track speed varies significantly from day to day based on weather, surface maintenance, and rail position. Speed figures adjust for these variables so that an 85 earned at Fair Grounds on a muddy track in January is comparable to an 85 earned at Saratoga on a fast track in August.
| Figure System | Creator | Where to Find It | What to Know |
|---|---|---|---|
| Beyer Speed Figure | Andrew Beyer / Daily Racing Form | Daily Racing Form only | The most widely cited speed figure in American racing. Scale roughly 0–120; elite horses run 100+; typical claiming horses run 65–85; maidens often run 55–75. A 5-point difference is meaningful; a 10-point difference is significant. |
| Equibase Speed Figure | Equibase | Equibase.com; free | Similar methodology to Beyer but independently calculated — figures are not directly comparable to Beyer. Consistently useful within the same figure system. |
| Brisnet Speed Rating | Brisnet | Brisnet.com; paid | Independent system with a slightly different scale. Includes pace figures (E1, E2, LP) that are valuable for pace handicapping. |
| TimeformUS | TimeformUS | Timeform.com; paid | Incorporates pace data more aggressively than Beyer; popular with pace-oriented handicappers. |
Look at a horse’s last three speed figures as a trend, not as individual data points. A horse with figures of 72-78-83 is improving — each race it has run faster than the last. A horse with figures of 88-82-79 is declining. A horse with figures of 80-79-81 is consistent.
Speed figure trend guide:
- Improving (72-78-83): Give credit for trajectory — the next figure may be higher than the last
- Declining (88-82-79): Discount recent form — something may be going wrong
- Consistent (80-79-81): Reliable baseline — what you see is likely what you’ll get
- Erratic (85-68-82): High variance — trip issues, surface problems, or inconsistent fitness
- Single big figure (72-74-91): Career best — check whether conditions were unusual before assuming it repeats
- Coming off layoff (no recent figures): Treat fitness as unknown; prioritize trainer layoff stats, workout quality, and whether connections have pointed the horse at this spot specifically
The most common speed figure mistake: Taking one big speed figure at face value without checking what produced it. Consider a horse that ran an 88 at Churchill Downs on a day when the rail was placed two paths out and 14 other horses ran career-best figures on the same card — that track was playing extremely fast, and the figures reflect conditions as much as the horse’s ability. Before treating any career-best figure as a reliable baseline, check whether multiple horses from that same field have gone on to run comparable figures elsewhere. Also check whether the horse ran on Lasix for the first time in the race that produced the big figure — where permitted, first-time Lasix may account for meaningful improvement by itself, which raises the question of whether the performance is repeatable under similar conditions. Always read the speed figure in context, not in isolation.
Reading Pace Fractions
Pace fractions are the intermediate times recorded at each timing point during a race — the quarter-mile, the half-mile, and (in route races) the three-quarter-mile. They tell you how fast the early part of the race was run and how much energy the field expended before the stretch. Pace is one of the most powerful handicapping tools in the form and one of the most underused by recreational bettors. For a complete guide to pace analysis, see the article on horse racing pace figures.
| Fraction | What It Measures | Fast vs. Slow Benchmark (6f dirt) |
|---|---|---|
| First quarter (:22–:24) | How fast the first two furlongs were run — the initial burst from the gate | :21 flat or faster = very fast; :23+ = slow early pace |
| Half-mile (:44–:47) | Cumulative time for the first four furlongs — the most commonly cited pace fraction | :43 or faster = hot pace; :46+ = slow pace favoring front-runners |
| Final time (1:10–1:13) | Completed distance time — useful only relative to speed figures and track variant | Context-dependent — use the speed figure, not the raw time |
Pace handicapping answers a question that speed figures can’t: given the horses in today’s field, how fast will the early fractions be — and which running styles does that favor? A field with three confirmed front-runners competing for the lead will run fast early fractions. Fast early fractions tire front-runners and benefit closers. A field with no early speed will set up for front-runners to steal the race on an uncontested lead.
Horseman’s Perspective: The scenario I look for most as a bettor is a field with one confirmed speed horse and several closers, where the speed horse has been running conservative early fractions in its recent races. No one to press it early means it can rate and save energy for the stretch. In that setup, even a front-runner with modest speed figures can beat closers with better figures — because it never gets tired. The form tells you the figures; pace analysis tells you what the race is going to look like before it’s run.
Trainer and Jockey Stats
Trainer and jockey statistics appear in a condensed line in most past performance formats — typically showing win percentage, in-the-money percentage (ITM%), and sometimes return on investment (ROI) for the current meet or the last 60–90 days. These numbers are among the most reliable predictors in the form and among the least used by casual bettors.
| Statistic | What It Means | What’s Meaningful |
|---|---|---|
| Trainer win % (W%) | Percentage of starts resulting in a win — current meet or last 60 days | A trainer at 20%+ generally warrants closer attention — though verify they have a meaningful sample of starts at this meet, not just a hot two- or three-race run. Sustained high win rates reflect a barn consistently placing horses in competitive spots. |
| Trainer ITM% | Percentage of starts finishing 1st, 2nd, or 3rd | 40–50% ITM with 12–15% win rate means consistently competitive. Useful for exacta and trifecta construction even when the trainer isn’t winning outright. |
| Jockey win % | Percentage of rides resulting in a win — current meet | Top 2–3 jockeys at any track win a disproportionate share of races. A top jockey switching onto a horse they didn’t ride last time is a meaningful upgrade signal. |
| Trainer/jockey combo | Win% when this specific trainer and jockey have worked together | DRF lists this stat — 30%+ combo rate is a strong positive. When a hot trainer puts a top jockey on a horse, the combination stat quantifies how often that pairing wins. |
| Trainer specialty stats | Win% for specific situations: first start after claim, layoff, turf debut, etc. | Available in DRF and Brisnet. A 35% first-off-claim rate is highly reliable. Specialty stats tell you which trainers are skilled in specific scenarios. |
Horseman’s Perspective: The trainer stat I look for before any other is “first start after claim” — how often does this trainer win with a horse in its first race after being claimed? Some trainers are exceptional at this; they claim horses, identify what’s been wrong, fix it, and run them back quickly in a spot where they can win. At regional tracks like Fair Grounds and Evangeline, I’ve learned which trainers have this skill and which don’t. When a horse I’m watching gets claimed by one of those trainers, the next start for that horse gets full attention regardless of how the recent form looks.
Equipment Changes
Equipment changes are noted in the past performances with small letter symbols — typically appearing at the end of the medication/equipment line for each race. They are among the most consistently useful and most consistently overlooked signals in the form. An equipment change suggests the trainer has identified a specific problem with the horse and is attempting to address it.
| Symbol | Equipment | What Problem It Addresses | Handicapping Signal |
|---|---|---|---|
| b | Blinkers on | Horse has been distracted, ducking in/out, or losing focus in the stretch | Often a meaningful positive. First-time blinkers can be a useful signal — particularly for trainers with a history of improving horses after equipment changes. Works best when supported by improving form, class placement, or pace advantages. |
| B | Blinkers off | Horse has been over-focused or anxious; trainer is trying to relax it | Moderate positive — less reliable than blinkers on, but worth noting. |
| f | Front wraps / bandages | Leg support — can indicate soreness or injury history | Neutral to slightly negative — not a reason to bet, but a reason to watch the horse warm up. |
| L | Lasix (Furosemide) | Exercise-induced pulmonary hemorrhage (EIPH) — bleeding in the lungs during exertion | Often viewed as a positive for first time. Where permitted, first-time Lasix has historically been considered a positive factor by many handicappers — though its impact varies by horse and jurisdiction. Note: race-day Lasix is restricted or prohibited in some graded stakes and certain racing circuits. Repeat L is background noise. |
| t | Tongue tie | Horse gets its tongue over the bit, causing breathing or control issues | Moderate positive for first time — same logic as blinkers; first-time addition signals a trainer fix. |
| No symbol where one existed | Equipment removed | Trainer is simplifying or trying something different | Less common than additions, but intentional changes deserve a second look. |
Horseman’s Perspective: First-time blinkers combined with a class drop is the combination I look for more than any other in the form. The trainer has identified a focus problem (hence the blinkers) and has put the horse in a softer spot to let it win. That’s two deliberate trainer decisions pointing in the same direction. When those two signals appear together at reasonable odds — 4-1 or better — I’m betting it. Not every time it wins, but over hundreds of races, this combination beats the takeout.
Workouts
Workout lines appear below the past performance lines and show the horse’s recent timed training runs at the track. The format is: date, track, distance, surface, time, and a notation for how the horse was asked to run (breezing vs. handily). A bullet point (•) before a workout indicates it was the fastest workout at that distance on that day at that track. For a deeper guide to what workouts reveal, see the article on understanding horse racing workouts.
| Workout Notation | What It Means |
|---|---|
| •5/10 FG 5f ft :59.3 B 3/12 | Bullet work: May 10 at Fair Grounds, five furlongs fast dirt, 59.3 seconds breezing, 3rd fastest of 12 horses. This horse is sharp — that’s as good as a workout gets. |
| B (breezing) | Horse ran under light urging, close to full effort — the standard workout notation. Evaluate by time and ranking, not the notation alone. |
| H (handily) | Horse was asked to run under more active urging — a sharper, more demanding work than breezing. A fast H work close to race day is a strong fitness signal. |
| Ranking (3/12) | This horse’s time ranked 3rd fastest of 12 horses working that distance that day. Top-3 is solid; bottom half is ordinary. |
| Bullet (•) | Fastest workout at that distance on that day at that track. A bullet 4–7 days before the race means the horse is pointed for this spot and ready to run. |
| No recent workouts (3+ weeks off) | No published workouts within three weeks of race day — could be private works off-track, but treat as unknown fitness until proven otherwise. |
For first-time starters — horses that have no past performance lines because they haven’t raced yet — the workout tab is everything. A two-year-old with four bullet workouts, regularly spaced at increasing distances, with a bullet five days out is the textbook profile of a horse the trainer is confident in. The public often overlooks first-time starters with outstanding workout tabs; sharp bettors know that workout-only profiling is a legitimate edge on maiden debut day.
What the Form Can’t Tell You
The form is a record of the past. It cannot tell you what has happened to a horse since its last published race — and a great deal can happen. Understanding what the form misses is as important as understanding what it contains.
| What the Form Misses | Why It Matters | Where to Find It |
|---|---|---|
| Current physical condition | A horse that looked great three weeks ago may have had a minor issue in training that no one outside the barn knows about | Paddock observation — watch how the horse moves, whether it’s sweating (hot horse), how it behaves during the post parade |
| Private workouts | Horses that work at private training facilities or off-hours at the track don’t show up in the published workout tab | If a horse has no published workouts but is entered and taking a prominent jockey, assume private works have occurred |
| Trip notes from recent races | A horse that finished 5th by 8 lengths may have been blocked, taken up, or forced very wide — none of which shows in the position calls | Race replays (free on Equibase and most ADW apps) — watching the replay of a horse’s last race reveals what the numbers hide |
| Barn morale and stable form | Some barns run hot collectively — multiple horses winning in a short stretch. Others go cold. The form shows individual records but not the barn’s overall momentum. | Track the trainer’s results over the current meet, not just the last 60 days |
| Jockey intentions | A top jockey getting off a horse to ride a different one in the same race is a significant negative signal — the form shows the change, but not the reason | Compare jockey names between the form and the actual entries — late jockey changes are visible on Equibase same-day |
| Turf debut suitability | A horse switching to turf for the first time has no turf record — but its breeding and works may suggest it will like the surface | Check sire and dam’s turf records — available in the DRF pedigree notes |
Horseman’s Perspective: The form tells you what happened. It doesn’t tell you why. Consider a horse that finished 6th beaten 8 lengths — on paper that looks like a bad race. Watch the replay and you might see it was checked twice in the first quarter, steadied again at the half, and forced five-wide into the stretch, then finished fastest of all horses in the final furlong. That’s a completely different race from what the numbers show. I’ve watched horses come back from what looked like terrible efforts on paper and run the best races of their careers — because something specific happened that the numbers can’t capture. Watching replays isn’t optional for serious handicappers. That’s where you find the horses the form is misrepresenting.
How to Read a Full Field in 10 Minutes
Once you know what to look for, reading a full field doesn’t take as long as beginners fear. Here is the system I use — a priority-ordered scan that gets from blank form to a betting opinion in about ten minutes for a typical eight-horse field.
| Step | What to Do | Time |
|---|---|---|
| 1 — Read the race header | Note the class level, conditions, distance, and surface. Ask: is this a class drop or rise for any horse? | 30 sec |
| 2 — Scan trainer win percentages | Flag any trainer running at 15% or higher. If a trainer is cold (under 8%), mentally discount those horses slightly. | 1 min |
| 3 — Check equipment changes | Compare the equipment line for the most recent race to the race before it. Flag any first-time additions — especially blinkers and Lasix. | 1 min |
| 4 — Read the last three speed figures for each horse | Build a rough pecking order by figure. Note improving horses (give extra credit), declining horses (discount), and single big figures (verify the race conditions). | 2 min |
| 5 — Check class of recent races | Is any horse dropping significantly in class? Is any horse moving up from a maiden win? Adjust the figure-based pecking order accordingly. | 1 min |
| 6 — Assess pace scenario | Identify front-runners by looking at position calls (1-1-1 or 2-1-1 patterns). Count them. If 3+ speed horses are in the field, the pace will be fast — favor closers. If 0–1 speed horses, front-runners benefit. | 2 min |
| 7 — Check workout recency | Flag any horse with a bullet workout in the last week. Flag any horse with no workouts in 3+ weeks off a layoff. | 1 min |
| 8 — Form your opinion | Which horse is the most live based on your five priority factors? Which is the public likely to underestimate? That gap — between your assessment and the odds — is where you bet. | 1 min |
The most important thing the 10-minute method teaches: The goal is not to find the best horse. The goal is to find the best bet. The best horse in the field is often obvious from the form — and it’s often already bet down to short odds that don’t represent value. The best bet is the horse whose actual chances are better than its odds suggest. Reading the form quickly and systematically is how you find those horses before the window closes.
Racing Form Cheat Sheet
Before the cheat sheet, here is what the five-factor system looks like applied to a single horse — the kind of read that takes about 90 seconds once you know the system.
Worked example — Horse #4 in today’s $16,000 claiming race:
- Speed figures (last 3): 79 — 82 — 84. Steadily improving. Give credit for the trajectory.
- Class: Last race was a $25,000 claimer. Today drops to $16,000. Full credit for those figures — they were earned at a higher level.
- Trainer win %: 22% at the current meet. Worth closer examination — this barn consistently places horses in competitive spots.
- Equipment: Blinkers added for today. No blinkers in any of the last five races. First-time addition — trainer is addressing a focus issue.
- Pace: Position calls from recent races show 2-2-1 patterns. This horse runs near the front. Only one other confirmed speed horse in today’s field — uncontested or near-uncontested lead likely.
Read: Four of the five major factors align positively — improving figures, class relief, hot trainer, first-time equipment change, and a pace scenario that suits the running style. That convergence is what the form reader is looking for. It doesn’t guarantee a win, but it identifies a horse whose chance may be better than the odds suggest. At 8-1 that’s an interesting bet. At 6-5 the same read probably means passing — the price has to justify the risk, and even four aligned factors don’t make a 6-5 shot a value play.
Bookmark this. Print it. Keep it next to the form until the system becomes automatic. A printable one-page version is available as a free download: Racing Form Cheat Sheet (PDF) — PP line anatomy, the five priority signals, speed figure trend guide, equipment change signals, pace rules, and betting principles on a single page.
Key Takeaways: How to Read a Racing Form
- Ignore raw final time — use the speed figure: Final time is meaningless without knowing how fast the track was that day; the speed figure is adjusted for track conditions and is the only truly comparable number across races
- Five signals drive 90% of decisions: Speed figures (trend, not single number), class context, trainer win percentage, equipment changes, and pace scenario — master these before looking at anything else
- Class context beats raw figures: An 80 earned dropping from $25,000 claiming is worth more than an 80 earned in maiden company; always read the figure in the context of the race it was earned in
- Trainer win % is the most reliable stat in the form: A trainer winning at 20%+ deserves your full attention on every horse they enter; the specialty stat to prioritize is “first start after claim”
- Equipment changes signal trainer intent: First-time blinkers and first-time Lasix are the two strongest positive additions; they mean the trainer identified a specific problem and fixed it
- Count the front-runners before betting: Three speed horses in the same field means a hot early pace and closers win; one lone speed horse means the front-runner can rate and conserve energy
- The best bet is not the best horse: The best horse is usually obvious and already bet to short odds; the best bet is the horse whose actual chances are better than the public believes — which is what systematic form reading reveals
FAQs: How to Read a Racing Form
What is a racing form in horse racing?
A racing form — more precisely called past performances — is a standardized record of each horse’s recent race history. It shows where the horse ran, how far, on what surface, in what class of race, what weight it carried, how it ran at each timing point, the final time, and a speed figure comparing that performance to other races. The Daily Racing Form (DRF) and Equibase publish the most widely used versions in American racing.
How do you read the numbers in a horse racing program?
Each line in the past performances represents one race, read left to right: date, track, distance, surface, race type and class, weight carried, post position, position at each timing call during the race (with lengths behind in superscript), final margin and position, final time, and speed figure. The position calls tell the story of how the race unfolded — a horse listed as 5-5-4-2-1 was a closer that came from behind; one listed as 1-1-1-1-2 was a front-runner that faded slightly at the end.
What is a Beyer Speed Figure?
A Beyer Speed Figure is a numerical rating of how fast a horse ran in a given race, adjusted for the speed of the track on that day. Created by Andrew Beyer and published exclusively in the Daily Racing Form, Beyer figures allow direct comparison across different tracks and different days. A horse that runs an 85 at Fair Grounds and an 85 at Saratoga theoretically ran equally fast performances. Typical claiming horses run in the 65–85 range; stakes-level horses run 90–110+; elite horses occasionally exceed 115.
What does the ‘L’ mean in horse racing past performances?
‘L’ stands for Lasix — the brand name for Furosemide, a diuretic medication used to prevent or reduce exercise-induced pulmonary hemorrhage (EIPH), or bleeding in the lungs during races. A horse listed with ‘L’ in its medication line ran on Lasix. First-time Lasix is a significant positive signal — horses running on Lasix for the first time often show dramatic improvement because the underlying condition was preventing them from running their best.
What does a bullet workout mean in horse racing?
A bullet workout (marked with a • symbol) is the fastest workout recorded at a specific distance on a specific day at that track. If a horse worked five furlongs on a Monday at Fair Grounds and its time was faster than all other horses who worked that distance that day, it gets a bullet. A bullet workout close to race day (4–7 days out) is a meaningful positive signal indicating the horse is sharp and ready to run.
How do you read pace fractions in horse racing?
Pace fractions are the intermediate times recorded at each timing point during a race — typically the quarter-mile, half-mile, and (in route races) three-quarter mile. Fast early fractions (:43 half-mile or faster in a sprint) indicate a hot pace that tires front-runners and benefits closers. Slow early fractions (:46+) favor front-runners who can set an easy tempo and conserve energy. Pace analysis answers which running style today’s race conditions favor.
What is the difference between Equibase and Daily Racing Form past performances?
Both Equibase and the Daily Racing Form (DRF) publish complete past performances for American horse races. The primary differences: Equibase is free (basic version) while DRF charges per card; DRF includes Beyer Speed Figures while Equibase uses its own independently calculated figures; DRF includes more detailed trainer and jockey statistics and specialty matchup data. For beginners, Equibase is the right starting point. For serious handicapping, most professionals use DRF for the Beyer figures and the depth of trainer and jockey data.
Can beginners win using only speed figures?
Speed figures are the best starting point for comparing horses, but relying on them alone is unlikely to produce consistent results. Class, pace, layoff status, trainer intent, equipment changes, and specific race conditions all affect whether a horse can reproduce its previous figure in today’s race. A horse with the highest figure in the field will win its share of races — but the question handicappers are trying to answer is whether that horse’s odds reflect its real chance. Speed figures help identify the likely contenders; the rest of the form explains when and why the figure horse might be beatable at value.
About Miles Henry
Racehorse Owner & Author | 30+ Years in Thoroughbred Racing
Miles Henry (legal name: William Bradley) is a professional horseman based in Folsom, Louisiana. He holds Louisiana Racing License #67012 and has spent over three decades managing Thoroughbreds at premier tracks including Fair Grounds, Delta Downs, and Evangeline Downs.
Expertise & Hands-On Experience: Beyond the track, Miles has decades of experience in specialized equine care, covering everything from hoof health and nutrition to training protocols for Quarter Horses, Friesians, and Paints. Every guide on Horse Racing Sense is rooted in this “boots-on-the-ground” perspective.
30 of their last 90 starts
Equibase Profile.
Connect with Miles: